There has been lots of talk recently about the increase in scoring in the NBA this season. The reasons seems obvious: the league’s recent move towards volume three-point shooting continues, and three rules changes have resulted in more fouls, more free throws and more possessions per game.
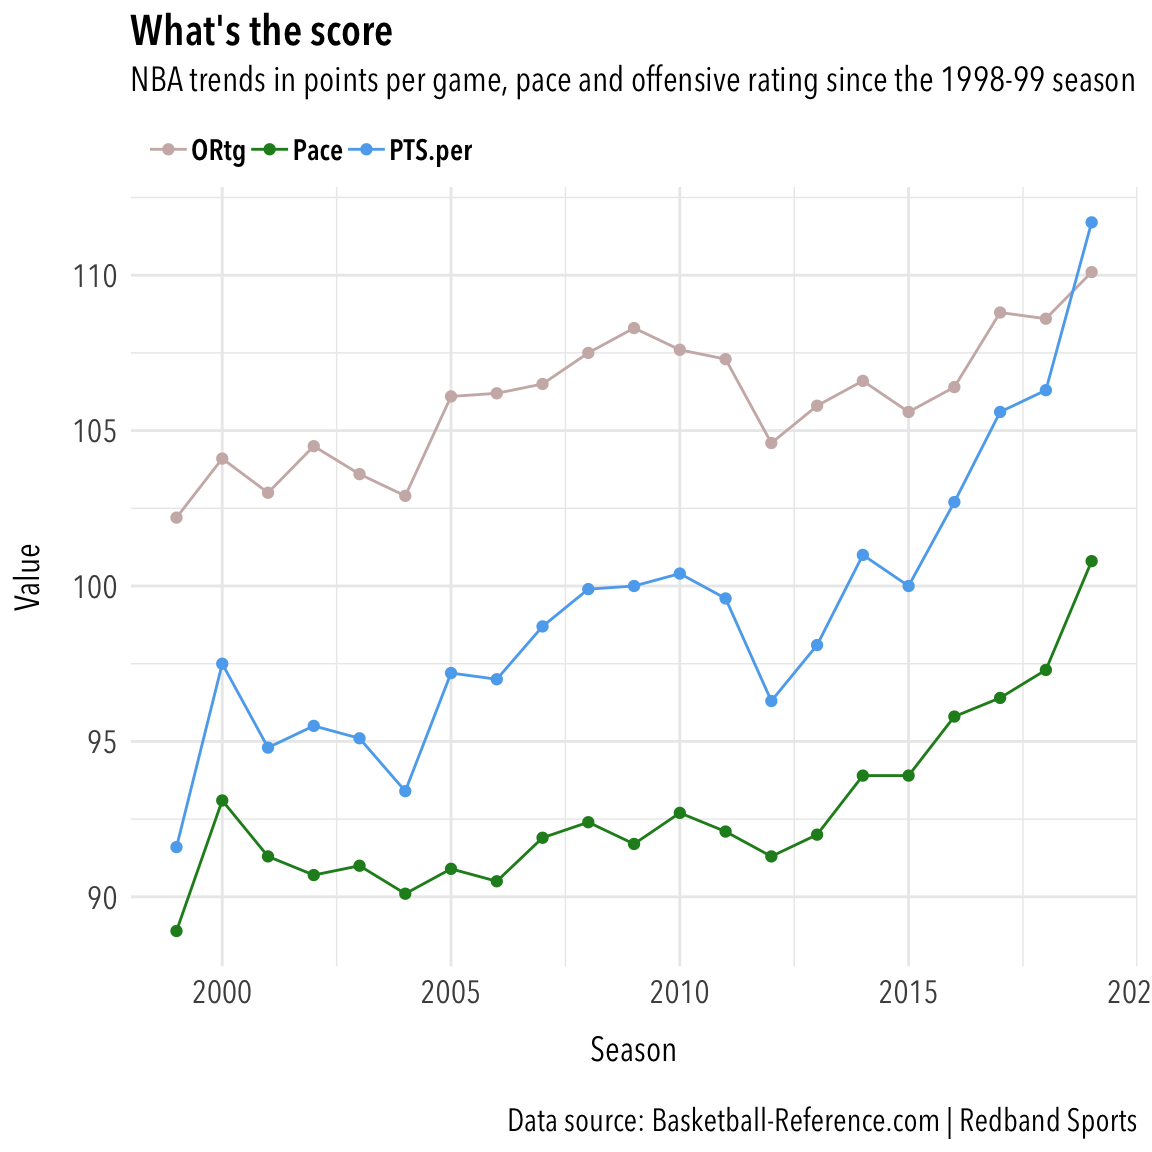
Through games of Monday, Nov. 5, here are the per-team per-game increases in free-throw attempts, possessions per 48 minutes (pace) and scoring:
| Statistic | Per team avg. | Increase |
|---|---|---|
| Free-throw attempts | 24.4 | 2.7 |
| Possessions per 40 mins. | 100.8 | 3.5 |
| Scoring | 111.7 | 5.4 |
Let’s look at the long-term trends in those three categories since offence bottomed out in the league in the 1998-99 season:

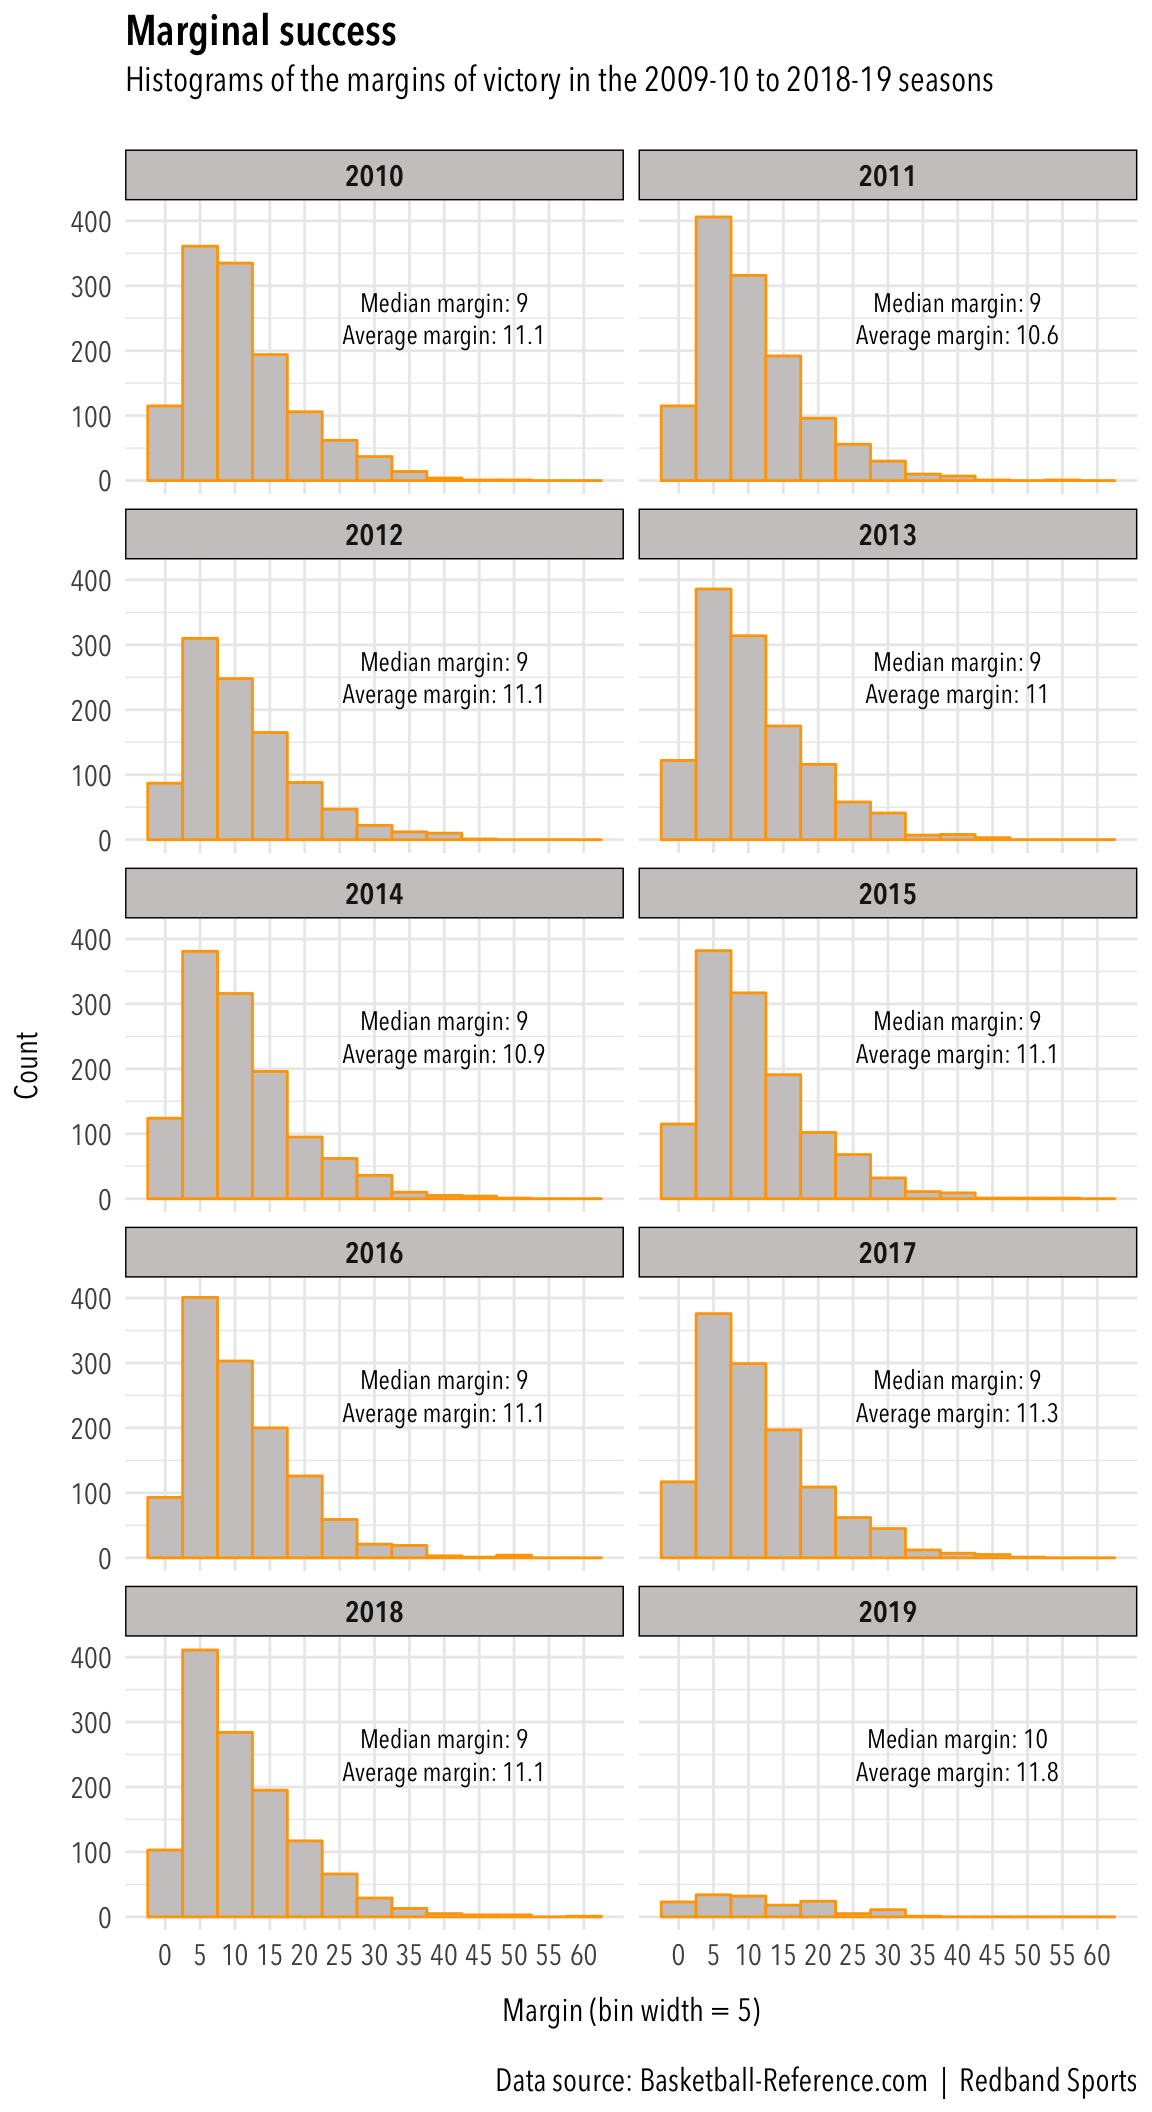
But what has caught my eye this season is the margins of victory. First, let’s look at histograms of the margin of victory in the last 10 seasons (including this one). Each bar represents groups of five (0-4 points, 5-9 points, 10-14 points, 15-19 points and so on).

In the previous nine seasons, including the lockout-shortened 2011-12 season, each histogram looks similar. The median margin of victory is 9 points and the average margin of victory is very close to 11 (except for the 2011-12 season, when it dipped half a point to 10.6).
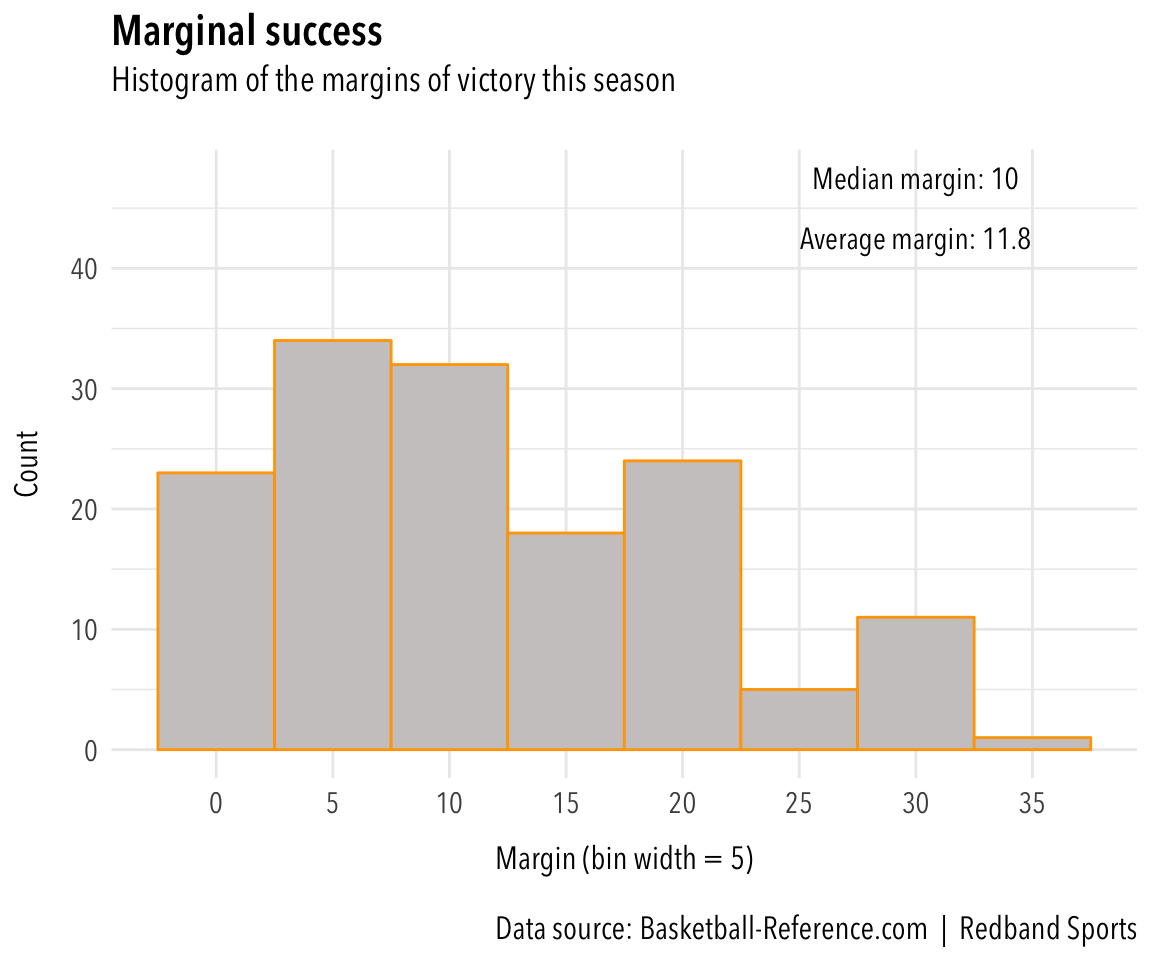
Let’s get a closer look at this season’s histogram after 148 games.

It’s interesting that the median margin has increased to 10 and the average has bumped up 0.7 points over last season. There’s a bigger cluster of games that have ended in victories of 20-24 points that you don’t see in the previous seasons. And even a spate of games with a margin of 30-34 points. If we look at the number of games with a margin of 20 or more points, we see a huge spike this season, up more than three times over last season.
| Season | Total | Games | Pct |
|---|---|---|---|
| 2010 | 170 | 1230 | 0.1382114 |
| 2011 | 151 | 1230 | 0.1227642 |
| 2012 | 149 | 990 | 0.1505051 |
| 2013 | 186 | 1230 | 0.1512195 |
| 2014 | 177 | 1230 | 0.1439024 |
| 2015 | 175 | 1230 | 0.1422764 |
| 2016 | 175 | 1230 | 0.1422764 |
| 2017 | 191 | 1230 | 0.1552846 |
| 2018 | 168 | 1230 | 0.1365854 |
| 2019 | 34 | 166 | 0.2048193 |
(Updated through games of Nov. 8, 2018)
It’s too early to call this a trend. Even with the amount of tanking that has happened in the past few seasons, there hasn’t been a corresponding spike in high-margin games, and this season could just be a small-sample anomaly. Perhaps there have just been a lot of lopsided matchups so far. But I’m interested to know whether the increase in three-point shooting will ever manifest itself in margins of victory. Could there be more situations where one team is hot from the arc and the opponent is cold? Could there be situations where some teams get better at three-pointers and start regularly beating up on teams that don’t.
Having plotted this season’s histogram several times over the past few days, the cluster at 20-24 points is already starting to recede to it’s more likely level. I’ll update as the season goes along.
Photo: Pixabay via Pexels.com