Last week, Birds All Day podcast cohost Drew Fairservice re-tweeted some over-under betting lines on individual home run totals for the coming baseball season.
Over on Goldy and Bryce Harper plz. https://t.co/Smha0KYulI
— Drew F (@DrewGROF) February 26, 2018
In the replies to the tweet, he wondered how the lines compared to projections. So let’s find out.
In addition to the lines contained in the tweet, which were from the Westgate Sports Book in Las Vegas, our data also contains home run totals from three projections published at FanGraphs: ZiPS, Steamer and Depth Charts, which is a blend of ZiPS and Steamer with projections for plate appearances applied by FanGraphs’ staff.
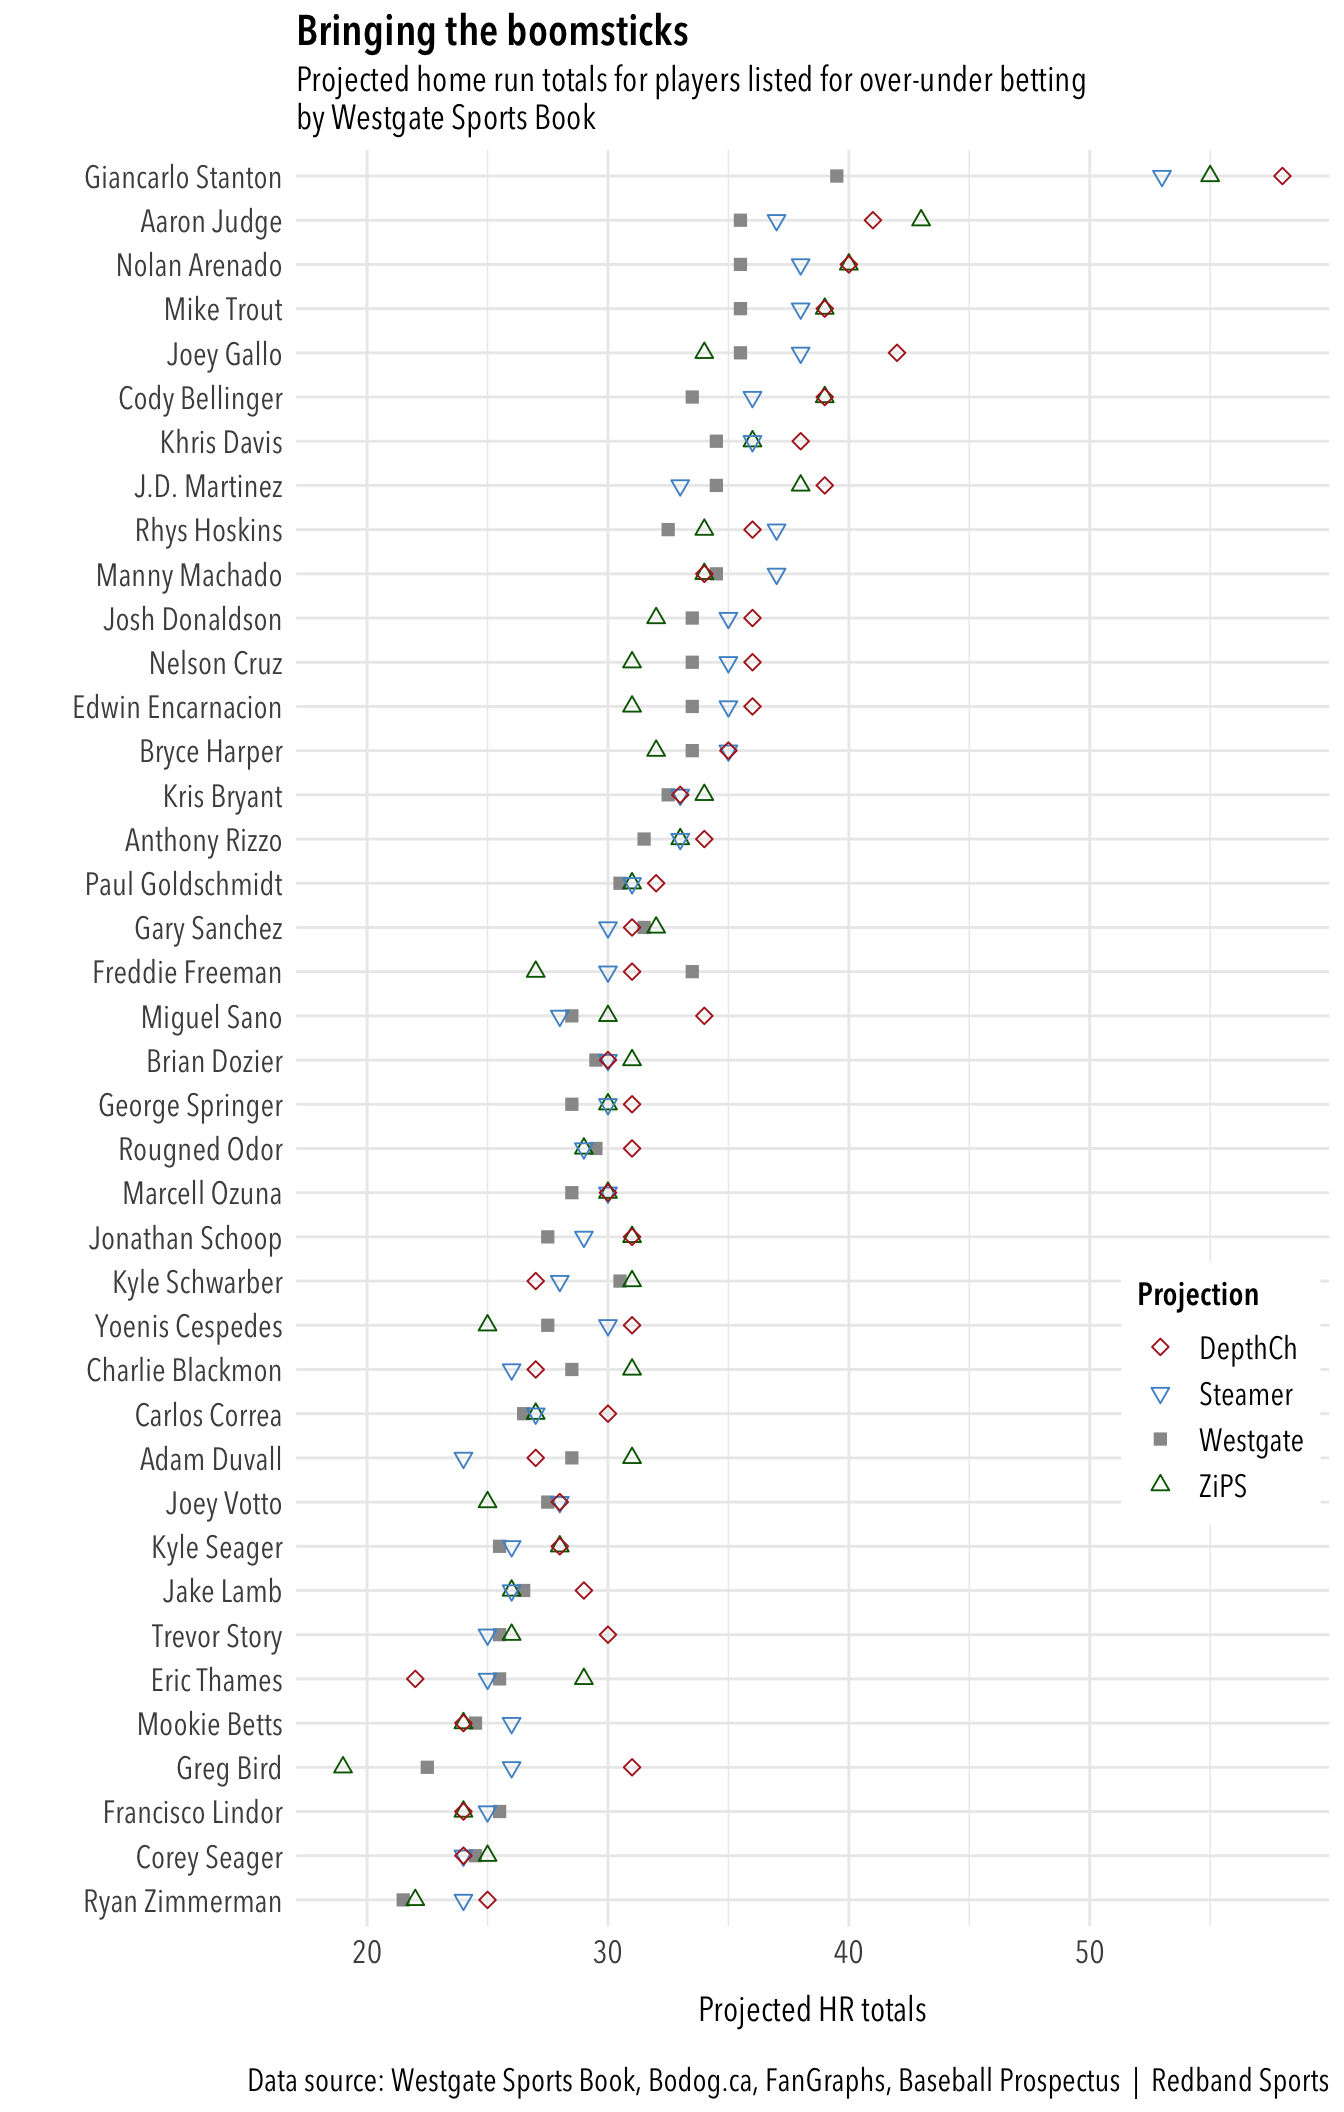
Here is a chart of the data, sorted roughly in descending order.

There is only one Blue Jays player, Josh Donaldson, offered by Westgate (11th from the top). His over-under is 33.5, which falls in the middle of the projections for his season. ZiPS projects him with 32, while Steamer has him at 35 and Depth Chart has him at 36.
In most cases, the data points for each player are clustered within a reasonable range, which makes the odd cases stick out. Near the bottom, there’s a wide range of projections for Yankees first baseman Greg Bird. ZiPS and Steamer don’t project him a full season of plate appearances, so when FanGraphs’ Depth Chart system applies nearly 600 PAs to his projected output, it likes him for 31 home runs.
The most interesting cases, though, are at the top, where Westgate is hedging its stance, at least in comparison to the projections. Projections for Aaron Judge, Nolan Arenado and Mike Trout are all above the over-under line. And Giancarlo Stanton is practically off the chart. The projections are bullish on him being able to top 50 home runs again after he shattered that barrier for the first time last season.
On the face of it, it seems odd that the projections would be that optimistic since Stanton has reached 600 plate appearances in only three of his eight seasons and he had never hit more than 37 homers in any year. Stanton could be expected to benefit from hitting inside a more productive lineup in New York, but he’s also switching leagues, which can have an effect. In 527 interleague plate appearances in his career, he has only 23 home runs.
While we are looking at projections, let’s look at how the sports books compare with the analytics projections for team wins.
Westgate also presented its over-under lines for wins last week. Our data also includes Bodog’s over-under lines and the projections from FanGraphs and Baseball Prospectus.
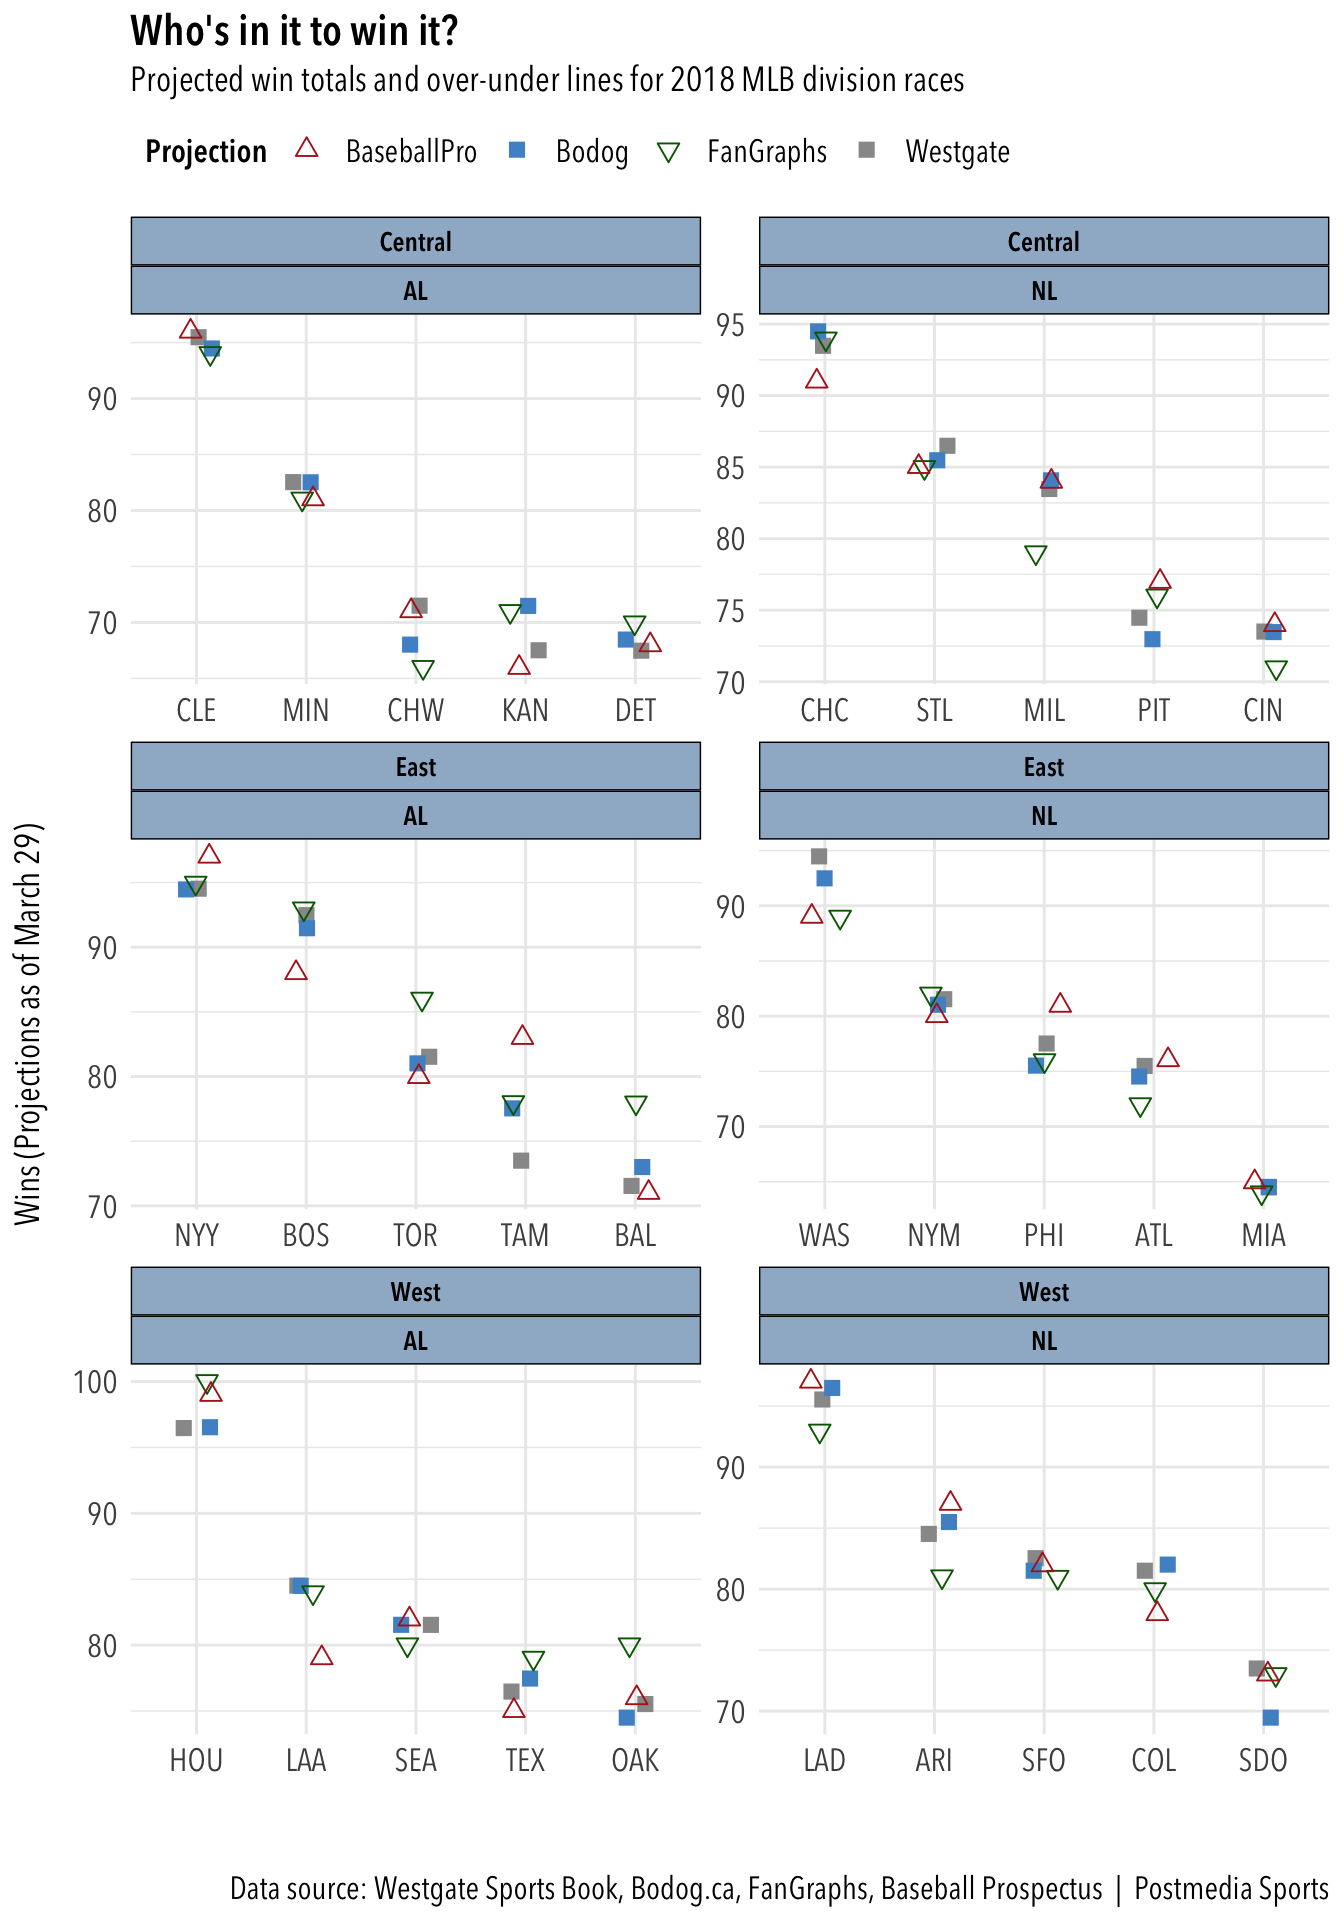
Here’s the data charted by league and division.

The projections would appear to show there won’t be much action for the division titles again this season. On Aug. 1 last season, the AL West, NL East and NL West races were done, with the leaders holding leads of 13 or more games. By Sept. 1, Cleveland had an eight-game lead in the AL Central.
Those same four teams — Cleveland, Houston, Washington and the Dodgers — are projected with wide leads over the other teams in their divisions. The Cubs, who underperformed last season and were late to clinch the NL Central, also have a wide projection margin. In the AL East, the Yankees and Red Sox are projected to easily earn playoff spots.
FanGraphs and Baseball Prospectus are split on which team will be the one most likely to mount a chase of the Yankees and Red Sox. FanGraphs likes the Blue Jays at 87 wins, while Baseball Prospectus prefers the Rays, although only at 84 wins.
Originally written for Hot Buttered Post at National Post